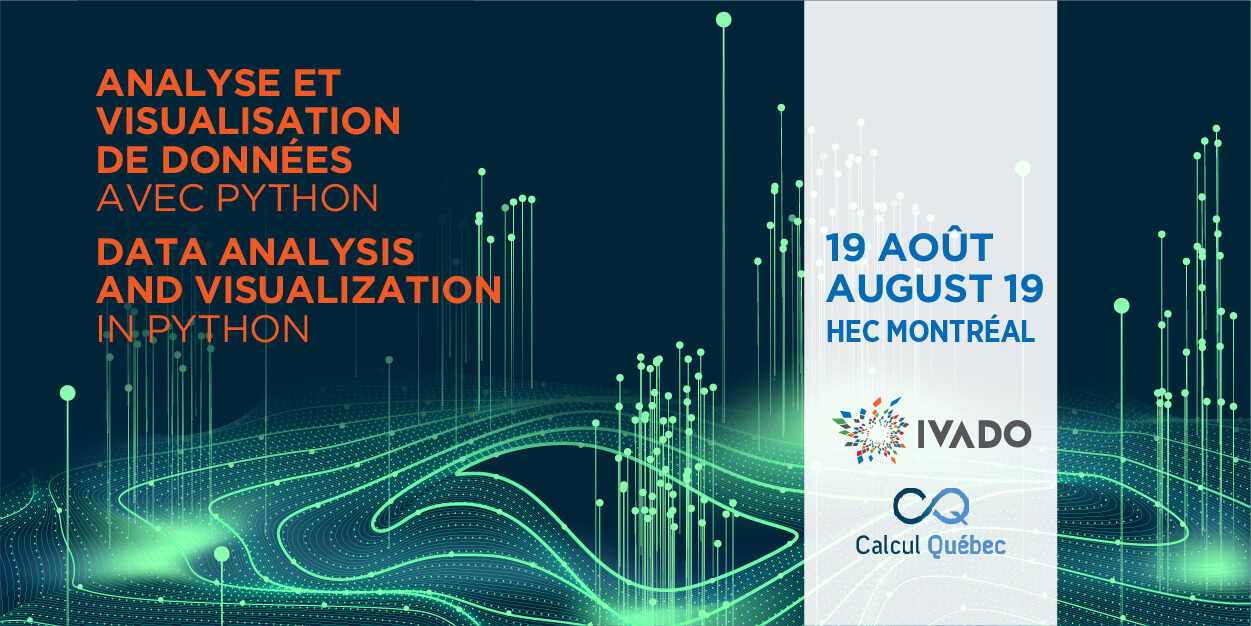
Monday, August 19th, 2019 | HEC Montréal
(English only)
À propos
Summary
This training is offered by Calcul Québec. We will use the Pandas and Matplotlib packages in order to manipulate, analyze and visualize data. This workshop uses the training material from Data Carpentry. Participants must bring their own laptops.
Target audience
The training is intended for anyone who wants to use Python to manipulate, analyze and visualize data.
Prerequisites
A basic knowledge of Python is strongly suggested.
Date and place
Monday, August 19th, 2019
HEC Montréal
Salle Raymond Chabot Grant Thornton
3000 Chemin de la Côte-Sainte-Catherine
Registration
General: $400
IVADO members: $200
Organizers
- Laurent Charlin, HEC Montréal (and Mila)
- Brian Moore, IVADO
Contact
For additional questions or inquiries, please contact formations@ivado.ca.
Lesson plan
- Pandas and DataFrames in Python
- Indexing, slicing and subsetting
- Data types and data format
- Combining DataFrames
- Data analysis automation
- Plotting with Matplotlib
- Accessing SQL using Python
